draw_critical_values#
- pycafee.normalitycheck.abdimolin.AbdiMolin.draw_critical_values(self, ax=None, export=None, extension=None, file_name=None, dpi=None, decimal_separator=None)#
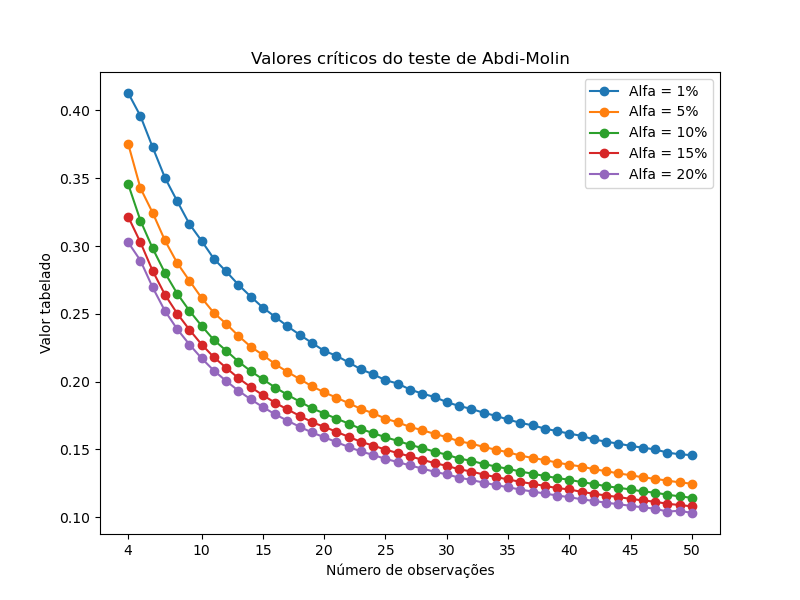
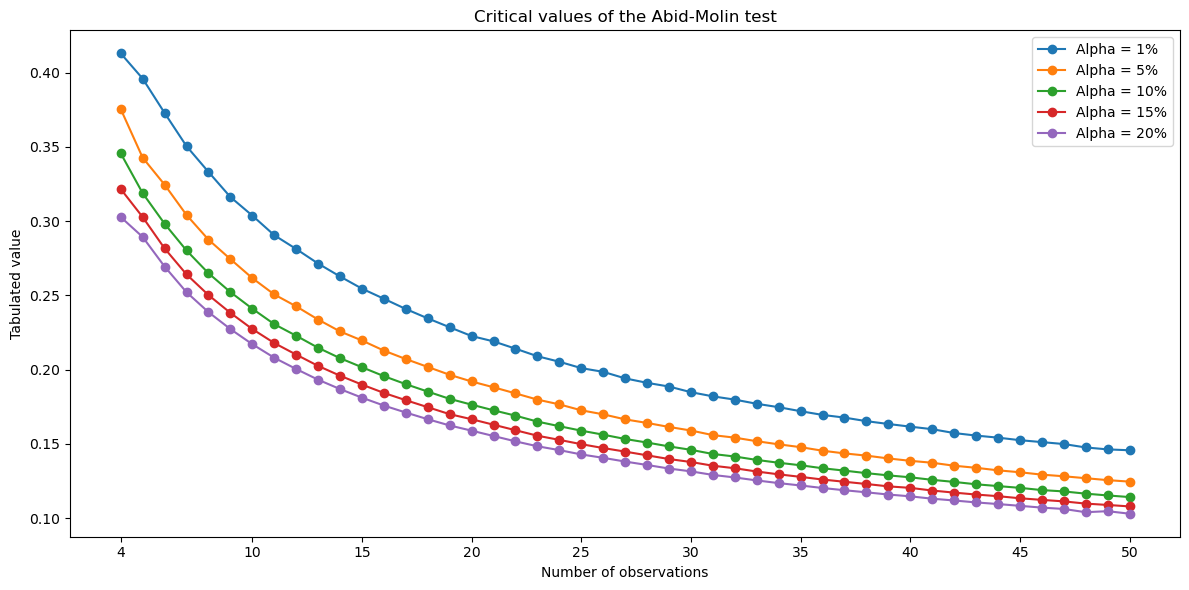
Draw a plot with the AbdiMolin [1] critical data.
- Parameters
- ax
Noneormatplotlib.axes.SubplotBase If
axisNone, a figure is created with a preset design. The other parameters can be used to export the graph.If
axis amatplotlib.axes.SubplotBase, the function returns amatplotlib.axes.SubplotBasewith the AbdiMolin critical data. In this case, the other parameters do not affect the graph.
- export
bool, optional Whether the graph should be exported (
True) or not (False). The default value isNone, which impliesFalse.- file_name
str, optional The file name. Default is
Nonewhich results in a file named"abdimolin_critical_plot".- extension
str, optional The file extension without a dot. Default is
Nonewhich results in a".png"file.- dpi
intorfloat, optional The figure pixel density. The default is
None, which results in a100 dpispicture. This parameter must be a number higher than zero.- decimal_separator
str, optional The decimal separator symbol used in the chart. It can be the dot (
Noneor'.') or the comma (',').
- ax
- Returns
- axes
matplotlib.axes._subplots.AxesSubplot The axis of the graph.
- axes
See also
get_critical_valueReturns the critical value for the AbdiMolin test.
fitperforms the AbdiMolin Normality test.
Notes
To obtain the critical values of the AbdiMolin test, use:
from pycafee.normalitycheck.abdimolin import AbdiMolin
abdimolin_test = AbdiMolin()
table = abdimolin_test.ABDIMOLIN_TABLE
References
- 1
SALKIND, N. J. Encyclopedia of measurement and statistics. California: SAGE Publications, Inc., 2007. DOI: 10.4135/9781412952644.
Examples
Using the figure created inside the function
>>> from pycafee.normalitycheck.abdimolin import AbdiMolin
>>> abdimolin_test = AbdiMolin()
>>> abdimolin_test.draw_critical_values(export=True)
The 'abdi_molin_critical_plot.png' file has been exported
Using a previously created figure
>>> from pycafee.normalitycheck.abdimolin import AbdiMolin
>>> import matplotlib.pyplot as plt
>>> abdimolin_test = AbdiMolin(language='pt-br')
>>> fig, ax = plt.subplots(figsize=(8,6))
>>> ax = abdimolin_test.draw_critical_values(ax=ax)
>>> plt.savefig("abdi_molin_plot.png")
>>> plt.show()