draw#
- pycafee.sample.studentdistribution.StudentDistribution.draw(self, gl, tcalc, alfa=None, ax=None, which=None, interval=None, legend=None, x_label=None, y_label=None, width='default', height='default', export=None, file_name=None, extension=None, dpi=None, tight=None, transparent=None, plot_design='gray', decimal_separator=None)#
This function draws a graph with the Student’s t distribution (one-sided or two-sided) for a given degree of freedom, combined with the calculated value of the statistic of this test for a sample with an alpha level of significance.
- Parameters
- gl
int, higher than 1 The degree of freedom of the sample
- tcalc
floatorint The calculated value of the Student’s t-test statistic
- alfa
float The level of significance,
0.0 < alfa < 1.0.- ax
Noneormatplotlib.axes.SubplotBase, optional If
axisNone, a figure is created with a preset design. The other parameters can be used to edit and export the graph.If
axis amatplotlib.axes.SubplotBase, the function returns amatplotlib.axes.SubplotBasewith the StudentDistribution axis. In this case, the parameters related to graph export will not influence the generated axis.
- which
str, optional The parameter which controls the t distribution to be ploted. The options are:
Noneor"two-side"(default): two-side"one-side": one-side
- interval
Noneorlist, optional The interval
If it is
None, it tries to find a suitable range to plot the graph.If it is a
list, thelistmust contain 2 positive numeric elements, where the first element defines the lower limit of the interval, and the second element defines the upper limit of the interval.
- legend
bool, optional Whether the legend should be added into the chart (
True) or not (False). The default value isNone, which impliesTrue.- x_label
str, optional The label to be displayed on x label. Default is
None, which results in"Student's t".- y_label
str, optional The label to be displayed on y label. Default is
None, which results in"Probability density".- width
"default",intorfloat(positive), optional The width of the figure. If it is
"default", it uses a pre-defined value. If it is a number, it defines thewidthof the chart (in inches).- height
"default",intorfloat(positive), optional The height of the figure. If it is
"default", it uses a pre-defined value. If it is a number, it defines theheightof the chart (in inches).- export
bool, optional Whether the graph should be exported (
True) or not (False). The default value isNone, which impliesFalse.- file_name
str, optional The file name. Default is
Nonewhich results in a file named"student_distribution".- extension
str, optional The file extension without a dot. Default is
Nonewhich results in a".png"file.- dpi
intorfloat(positive), optional The figure pixel density. The default is
None, which results in a100 dpispicture. This parameter must be a number higher than zero.- tight
bool, optional Whether the graph should be tight (
True) or not (False). The default value isNone, which impliesTrue.- transparent
bool, optional Whether the background of the graph should be transparent (
True) or not (False). The default value isNone, which impliesFalse(white).- plot_design
strordict, optional The plot desing. If
"gray", uses a gray-scale desing (default). If"colored", uses a colored desing. Ifdict, it must have fourkeys("distribution","area-rejection","area-acceptance","tcalc"), where each one defines the design of each element added to the chart.- decimal_separator
str, optional The decimal separator symbol used in the chart. It can be the dot (
Noneor'.') or the comma (',').
- gl
- Returns
- axes
matplotlib.axes._subplots.AxesSubplot The axis of the graph.
- output
dict A dictionary with the data used to plot the graph.
If
which = "two-side"If
which = "one-side"
- axes
Notes
The
plot_designparameter must be a dict where thevaluesfor allkeysmust be alist. Thelistof the key"distribution"must have:the first element must be a
strwith the color name;the second element must be a
strwith line style;the third element must be a number (
intorfloat, positive) with the line thickness;
The
listof the key"tcalc"must have:the first element must be a
strwith the color name;the second element must be a
strwith the marker;the third element must be a number (
intorfloat, positive) with size of the marker;
The
area-rejectionandarea-acceptancelistsmust have a single element, which is astrwith the name of the color that fills the area between the distribution line and the liney = 0. For example:plot_design = { "distribution": ['k', '-', 1.5], "area-rejection": ['gainsboro'], "area-acceptance": ['white'], "tcalc": ['k', 'o', 50], }
A list of color names can be found at matplotlib’s documentation.
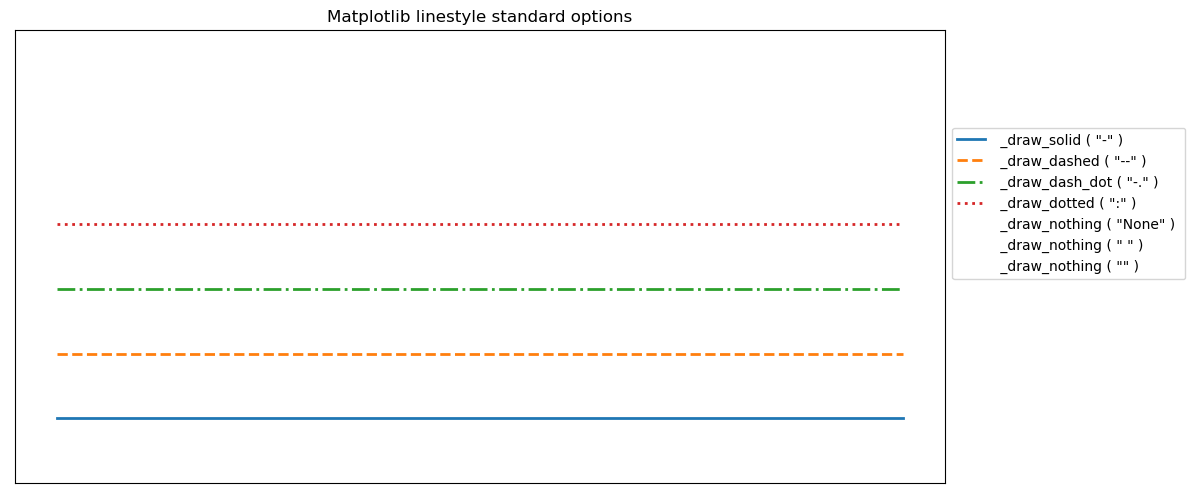
A list of linestyles can be found here.
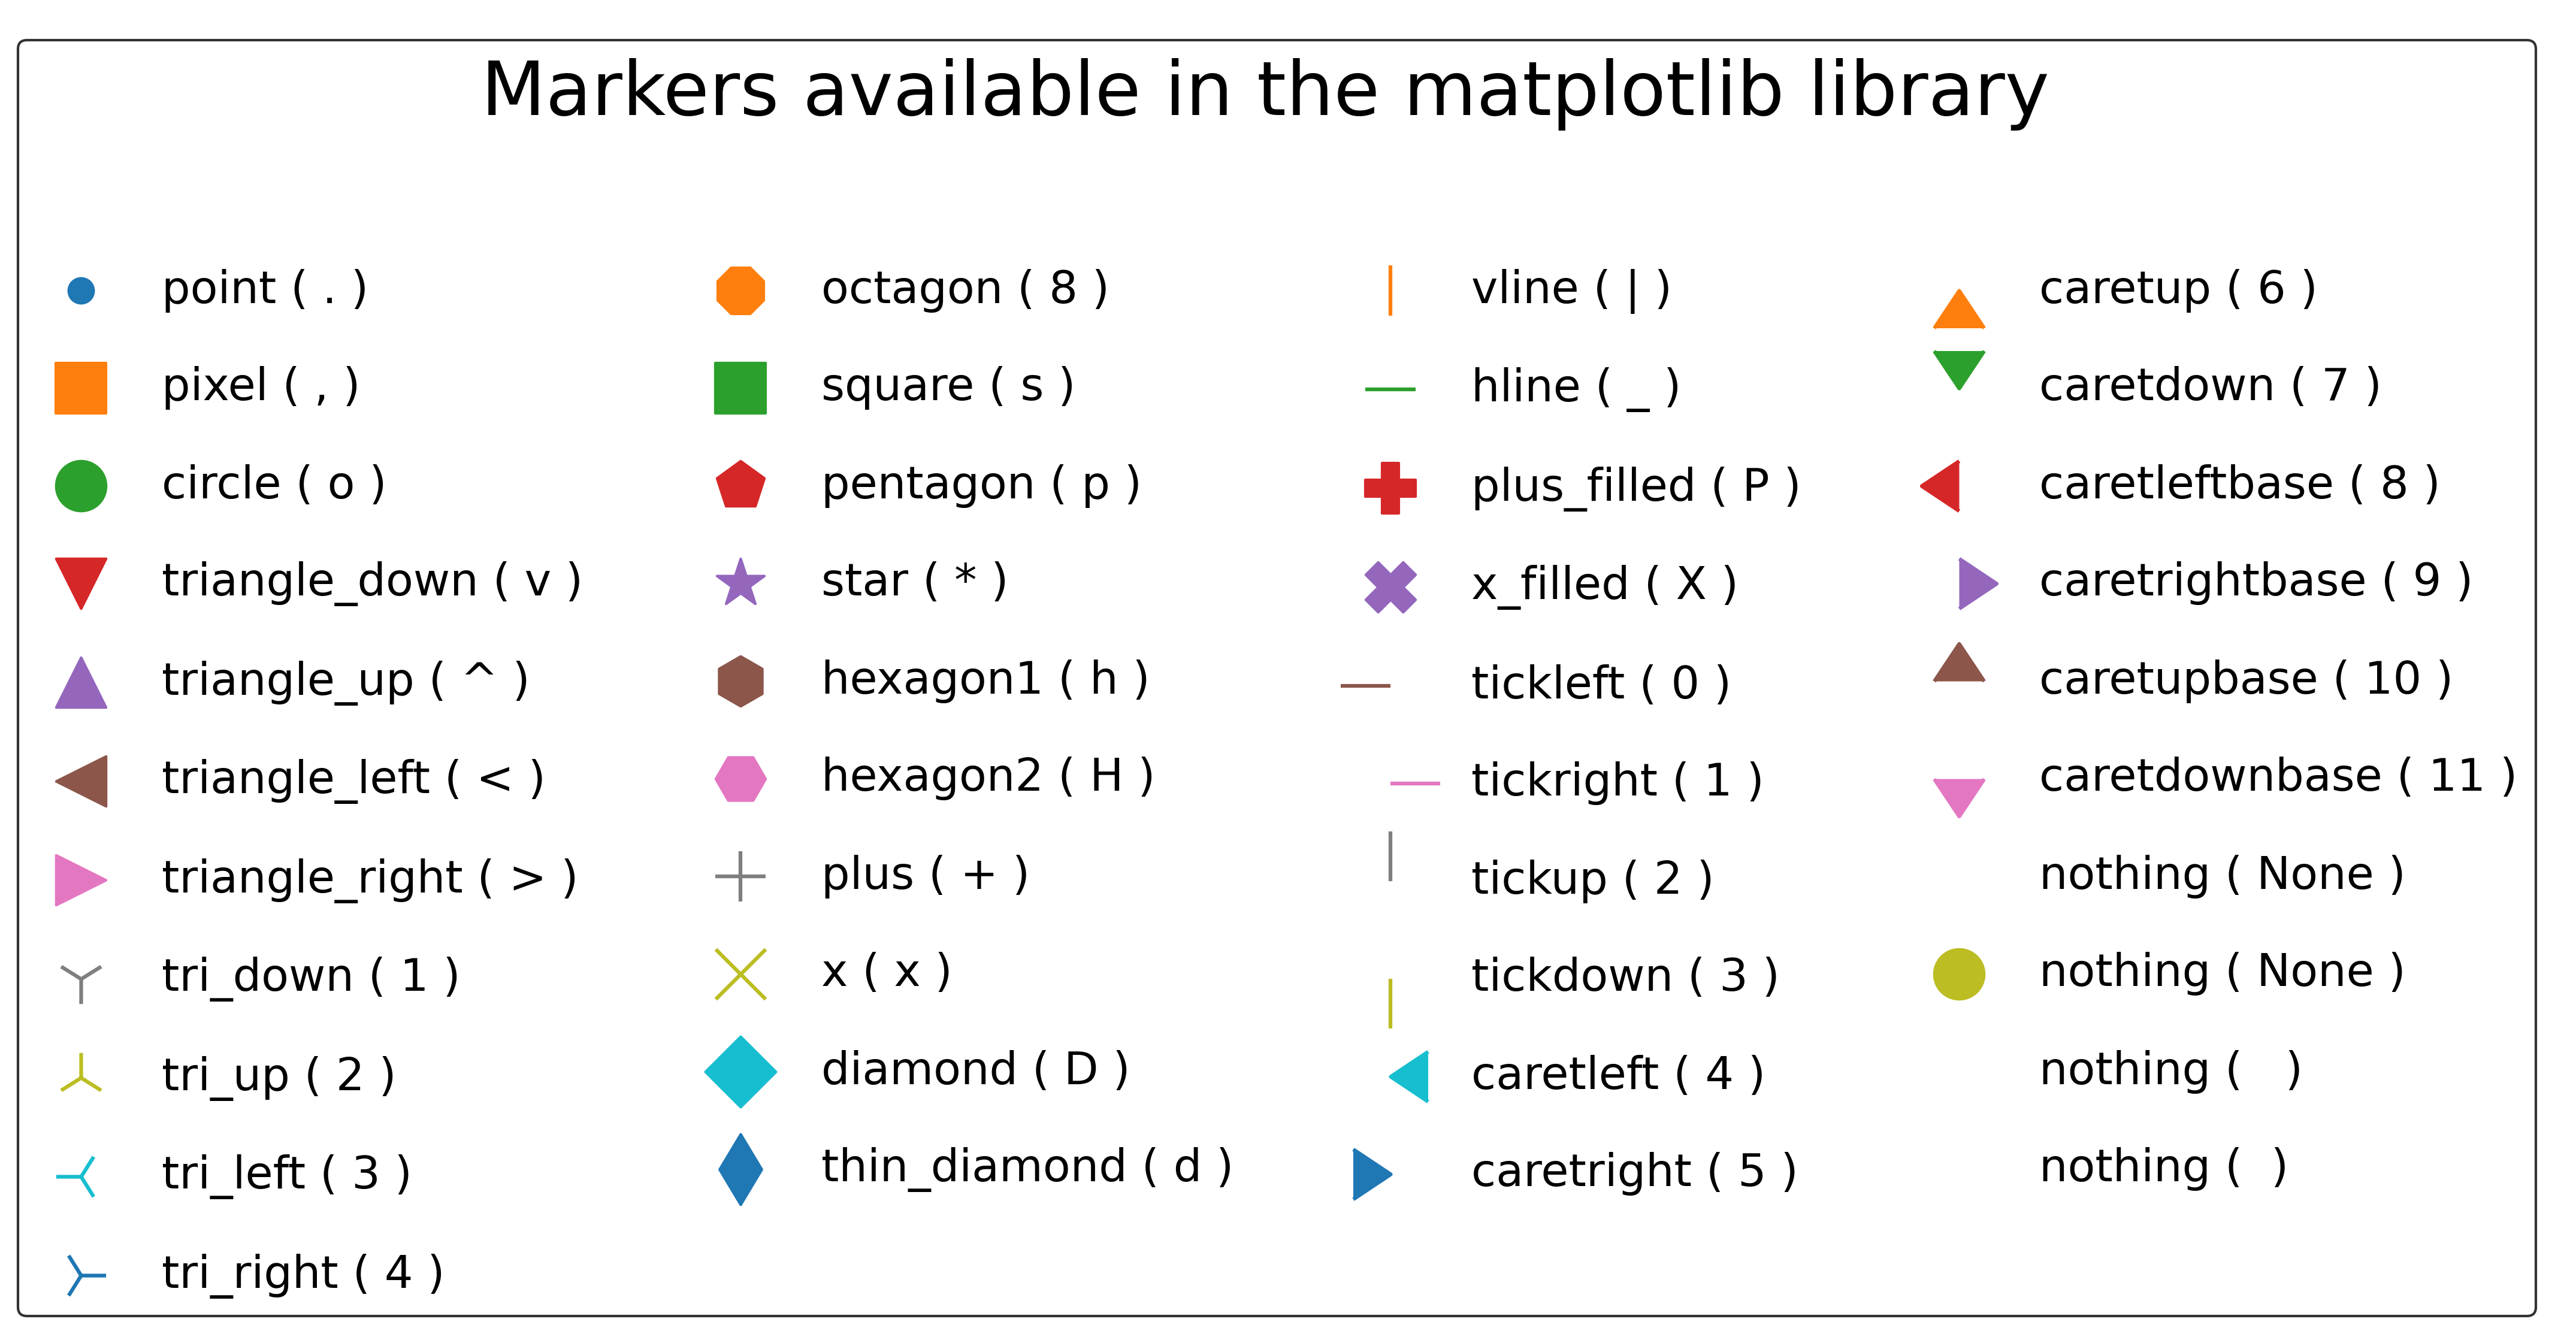
A list of makers can be found on this link.
The critical values for the sample are obtained using the scipy percent point function [1]:
stats.t.ppf(1-alfa/2, gl) or stats.t.ppf(alfa/2, gl) # for the two-side distribution
stats.t.ppf(1-alfa, gl) or stats.t.ppf(alfa, gl) # for the one-side distribution
The density values are estimated using the scipy probability density function [1]:
stats.t.pdf(x,gl)
References
- 1(1,2)
SCIPY. scipy.stats.t. Available at: www.scipy.org. Access on: 10 May. 2022.
Examples
>>> from pycafee.sample.studentdistribution import StudentDistribution
>>> student = StudentDistribution()
>>> axes, output = student.draw(gl=4,tcalc=3.15, export=True)
    The 'student_distribution.png' file was exported!

>>> from pycafee.sample.studentdistribution import StudentDistribution
>>> student = StudentDistribution()
>>> axes, output = student.draw(gl=4,tcalc=-3.15, export=True, plot_design='colored', file_name='my_data')
    The 'my_data.png' file was exported!

>>> from pycafee.sample.studentdistribution import StudentDistribution
>>> student = StudentDistribution(language='pt-br')
>>> axes, output = student.draw(gl=4,tcalc=1.15, which='one-side', export=True, plot_design='colored', file_name='meus_dados')
    O arquivo 'meus_dados.png' foi exportado!
