DotPlot#
- class pycafee.normalitycheck.dotplot.DotPlot(language=None, **kwargs)[source]#
Methods
draw(x_exp[, ax, legend_label, x_label, ...])This function draws a dot plot with a predefined design
Returns the current language
set_language(language)Changes the current language
- draw(x_exp, ax=None, legend_label=None, x_label=None, width='auto', height='auto', export=None, file_name=None, extension=None, dpi=None, tight=None, transparent=None, n_ticks=None, legend=None, decimal_separator=None)[source]#
This function draws a dot plot with a predefined design
- Parameters
- x_exp1D numpy array
A
1dimension numpy array with the dataset- ax
Noneormatplotlib.axes.SubplotBase If
axisNone, a figure is created with a preset design. The other parameters can be used to edit and export the graph.If
axis amatplotlib.axes.SubplotBase, the function returns amatplotlib.axes.SubplotBasewith the dotplot axis. In this case, parameters relatd to whtfigwill not affect the graph.
- legend
bool, optional Whether the legend should be add into the chart (
True) or not (False). The default value isNone, which impliesFalse.- legend_label
str, optional The label to be displayed on the legend. Default is
None, which results in"data". Only valid iflegend = True.- x_label
str, optional The label to be displayed on x label. Default is
None, which results in a blank label.- width
"auto","default",intorfloat(positive), optional The
widthof the figure.If it is
"auto", it tries to figure out a nicewidthfor the plot using the data range.If it is
"default", it uses a pre-defined value.If it is a number, it defines the
widthof the chart (in inches).
- height
"auto","default",intorfloat(positive), optional The
heightof the figure.If it is
"auto", it tries to figure out a nice height for the plot using the data range.If it is
"default", it uses a pre-defined value.If it is a number, it defines the height of the chart (in inches).
- export
bool, optional Whether the graph should be exported (
True) or not (False). The default value isNone, which impliesFalse.- file_name
str, optional The file name. Default is
Nonewhich results in a file named"dot_plot".- extension
str, optional The file extension without a dot. Default is
Nonewhich results in a".png"file.- dpi
intorfloat(positive), optional The figure pixel density. The default is
None, which results in a100 dpispicture. This parameter must be a positive number.- n_ticks
int(positive), optional The number of evenly spaced ticks to be drawn on the x-axis. The default is
None, which uses matplotlib default parameter.- tight
bool, optional Whether the graph should be tight (
True) or not (False). The default value isNone, which impliesTrue.- transparent
bool, optional Whether the background of the graph should be transparent (
True) or not (False). The default value isNone, which impliesFalse(e.g, white background).- decimal_separator
str, optional The decimal separator symbol used in the chart. It can be the dot (
Noneor".") or the comma (",").
- Returns
- xnumpy array
The
xvalues used to plot the graph.- ynumpy array
The
yvalues used to plot the graph.- axes
matplotlib.axes._subplots.AxesSubplot The axis of the graph.
References
- 1
Inspired by FITZGERALD, P. How to create a “dot plot” in Matplotlib? (not a scatter plot). Available at: stackoverflow.com. Access on: 10 May. 2022.
Examples
Drawing a dot plot with default parameters
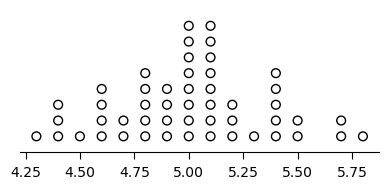
>>> from pycafee.normalitycheck.dotplot import DotPlot
>>> import numpy as np
>>> x = np.array([
            5.1, 4.9, 4.7, 4.6, 5.0, 5.4, 4.6, 5.0, 4.4, 4.9, 5.4, 4.8, 4.8, 4.3, 5.8, 5.7, 5.4, 5.1, 5.7,
            5.1, 5.4, 5.1,4.6, 5.1, 4.8, 5.0, 5.0, 5.2, 5.2, 4.7, 4.8, 5.4, 5.2, 5.5, 4.9, 5.0, 5.5, 4.9, 4.4,
            5.1, 5.0, 4.5, 4.4, 5.0, 5.1,4.8, 5.1, 4.6, 5.3, 5.0
            ])
>>> dotplot = DotPlot()
>>> x, y, axes = dotplot.draw(x, ax=None, export=True)
    The 'dot_plot.png' file was exported!
Drawing a dot plot
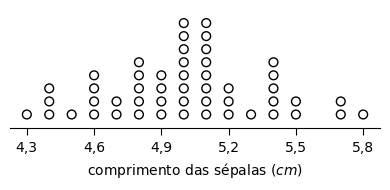
>>> from pycafee.normalitycheck.dotplot import DotPlot
>>> import numpy as np
>>> x = np.array([
            5.1, 4.9, 4.7, 4.6, 5.0, 5.4, 4.6, 5.0, 4.4, 4.9, 5.4, 4.8, 4.8, 4.3, 5.8, 5.7, 5.4, 5.1, 5.7,
            5.1, 5.4, 5.1,4.6, 5.1, 4.8, 5.0, 5.0, 5.2, 5.2, 4.7, 4.8, 5.4, 5.2, 5.5, 4.9, 5.0, 5.5, 4.9, 4.4,
            5.1, 5.0, 4.5, 4.4, 5.0, 5.1,4.8, 5.1, 4.6, 5.3, 5.0
            ])
>>> dotplot = DotPlot()
>>> x, y, axes = dotplot.draw(x, ax=None, export=True, file_name="my_data", decimal_separator=",", n_ticks=6, x_label='comprimento das sépalas ($cm$)')
    The 'my_data.png' file was exported!
Drawing a dot plot using a previously created figure
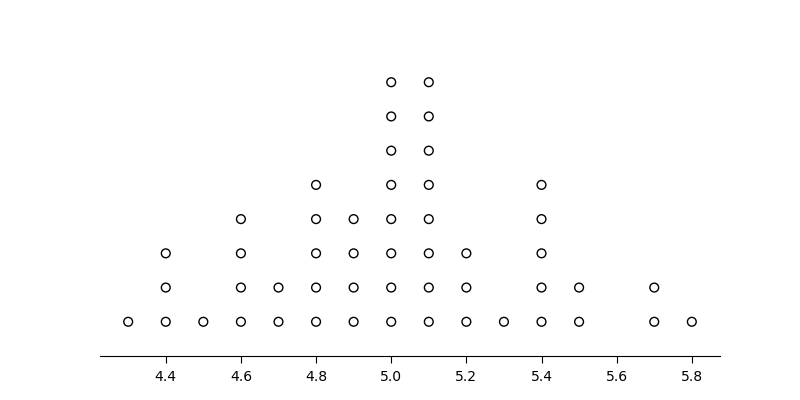
>>> from pycafee.normalitycheck.dotplot import DotPlot
>>> import numpy as np
>>> import matplotlib.pyplot as plt
>>> x = np.array([
            5.1, 4.9, 4.7, 4.6, 5.0, 5.4, 4.6, 5.0, 4.4, 4.9, 5.4, 4.8, 4.8, 4.3, 5.8, 5.7, 5.4, 5.1, 5.7,
            5.1, 5.4, 5.1,4.6, 5.1, 4.8, 5.0, 5.0, 5.2, 5.2, 4.7, 4.8, 5.4, 5.2, 5.5, 4.9, 5.0, 5.5, 4.9, 4.4,
            5.1, 5.0, 4.5, 4.4, 5.0, 5.1,4.8, 5.1, 4.6, 5.3, 5.0
            ])
>>> dotplot = DotPlot()
>>> fig, ax = plt.subplots(figsize=(8,4))
>>> x, y, ax = dotplot.draw(x, ax=ax)
>>> plt.savefig("new_plot.png")
>>> plt.show()
- get_language()#
Returns the current language
- set_language(language)#
Changes the current language
- Parameters
- language
str The language code
- language
Notes
The
languagemust be astrwith no more then5elements.